

And just like that – June 2026 has come and gone. Thank you to everyone who has submitted over the past month. We’ve grown from approximately 100 submissions per line to around 230 submissions per line in just a month. Every call you submit helps the tax practitioner community gain more visibility into IRS operations. With that, here’s the recap for the month:
June 2026 Snapshot
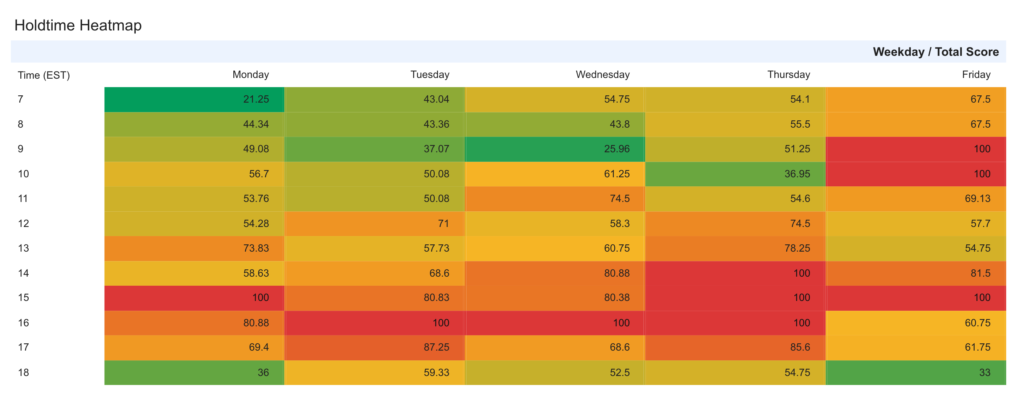
PPS – Individual
Calls logged: 238
Average reported hold time: 30 Minutes
Callback percentage: 33.94%
Courtesy disconnect rate: 54.62%
Best times to call:
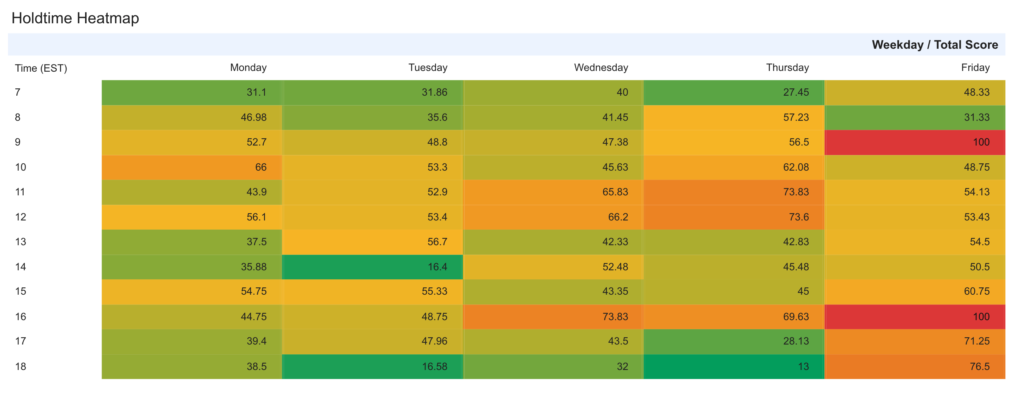
PPS – Business
Calls logged: 228
Average reported hold time: 40 Minutes
Callback percentage: 44.72%
Courtesy disconnect rate: 29.39%
Best times to call:
Interesting Insights
- Similar to last month, PPS Business showed lower disconnect rates than PPS Individual.
- PPS Individual shows peak busy times of Friday mornings and between 3 PM – 5 PM EST each day of the week.
- Friday is the busiest day of the week for the PPS Business line.
- From May 2026 to June 2026, courtesy disconnects on both PPS Individual and PPS Business dropped by 28.45% and 47.88%, respectively.
Data Limitations
This dataset is currently an early-stage practitioner sample. A significant portion of records have been submitted by the project creator, with additional submissions from practitioners who have contributed to the database. The data should be viewed as an emerging indicator of practitioner experience rather than a statistically representative measurement of all IRS call volume.
Looking Ahead
Tax Operation Report is continuing to expand it’s practitioner-submitted dataset. If you call the IRS, consider contributing your experience to help improve visibility into IRS phone accessibility. Each call record helps improve the visibility practitioners have into IRS phone accessibility.
Have you called the IRS recently?